| Home | Job | Pinball | Photo Album | Automotive | Press/Awards | Contact |

Water Heater
Monitor
This project is a
monitor for my gas
water heater. It
consists of a phototransistor aimed at the burner through a small
viewing window.
Since
I have a new 'Flame Lock' style burner, access to the combustion
chamber
is very limited, and I was unsure if enough light would hit the
phototransistor. This project was started and completed in
one
weekend (hardware and most of the software).

Schematic of the monitor. R1 is adjusted to produce a full logic swing with the gain and incident light of the phototransistor. The OUT terminal is connected to the Power Monitor Node, which was already hosting the water meter monitor. I do not have a part number for the transistor as it was from my spare parts bin.
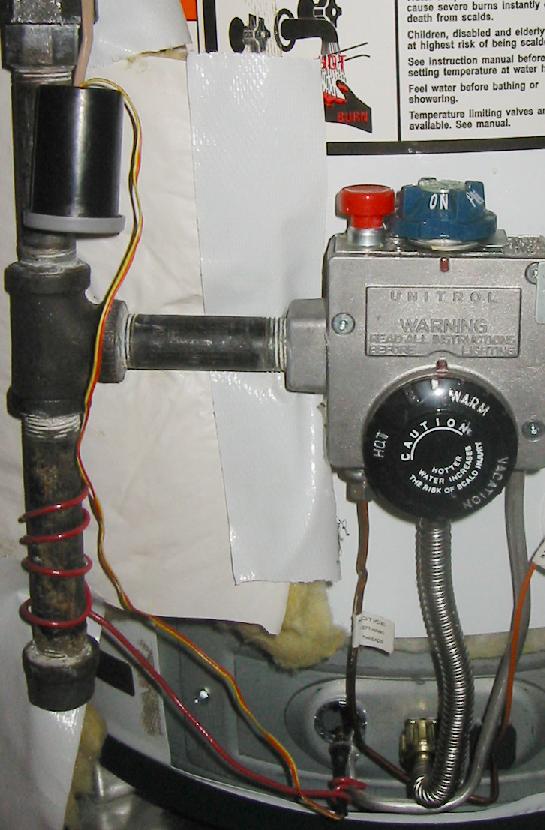
The water heater monitor before the wiring was dressed with ty-wraps.
The phototransistor is held by a stiff 16 gauge copper wire (red) so
that it can be freely positioned in front of the window.
The black film container holds the R1 resistor and
has enough room to allow reconfiguration of
the circuit.

Close-up of the phototransistor. It is held in a two pin socket that is soldered to the
wiring and then wrapped with heat shrink. The red copper wire is then wrapped
around the heat shrink to hold the assembly. The glass lens of the phototransistor
does not touch the little glass window of the combustion chamber.
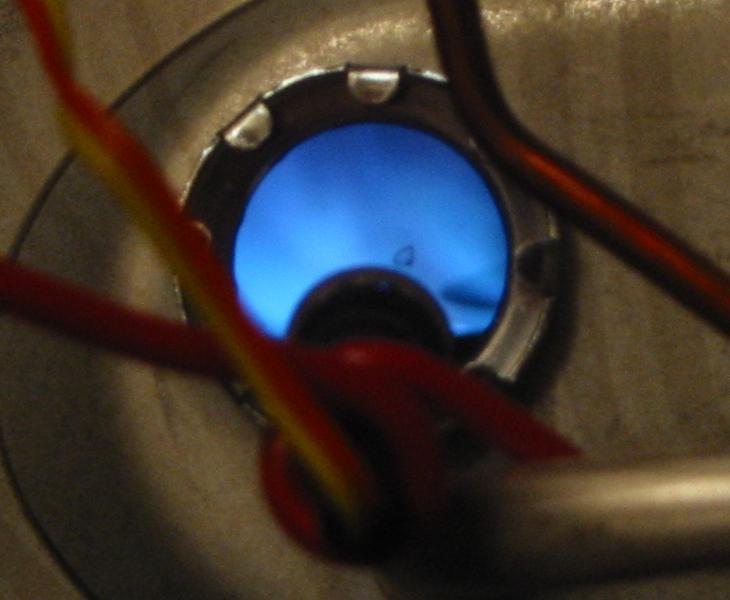
View along the phototransistor aimed at the burner. The sensor is aimed at the
brightest part of the flame. By manually dialing the thermostat on the water heater, I could fine tune the value of R1 to optimize the signal.
Cost analysis of a shower
The home control system allows me to plot any of 24 parameters that are monitored by the system. The chart below shows only the water usage and the gas water heater run time. The latter added as part of this project.
Chart with only the water
usage and
gas water heater run time plotted. The
chart has been zoomed into the region of when the shower took place. The user is able to position a cursor to read the data value at any time and point in the chart. The axis for the water heater run time is on the left (cumulative minutes - red trace),
and the axis for water usage is on the right (gallons - yellow trace).
A cost analysis of this shower is as follows:
| Item |
Amount |
Units |
| Length of shower |
13 |
minutes |
| Amount of water used |
24 |
gallons |
| Run time of water
heater |
21 |
minutes |
| Gas consumption rate |
0.5 |
cubic feet/minute |
| Amount of gas used |
10.5 |
cubic feet |
| Cost of water and
sewer |
5.75 |
dollars/1000 gallons |
| Cost of natural gas |
1.304 |
dollars/100 cubic
feet (CCF) |
| Cost of water
consumed |
0.138 |
dollars |
| Cost of gas consumed |
0.137 |
dollars |
| Total
cost of
shower |
0.275 |
dollars |
| Shower
cost
rate |
2.1 |
cents/minute |
The gas usage rate of
the gas water
heater was determined by using the dials on my gas meter and a
stopwatch. The 'half cubic foot per rev' dial makes one full
revolution per minute when the gas water heater is running.
Future uses of this system
- A monitor for a setback
system to
turn the
temperature down during vacations or
overnight periods. The actuator for this may, for example, be
an
RC servo. Proper safety measures would need to be in place to
prevent the accidental setting of a very hot temperature.
- The monitoring of the energy usage of the home if I should install a radiant heat system.
- After some usage, I may
setup a
software monitor to alert me if
the water heater burner runs beyond a time threshold.
Project Log
- October 10, 2004 - Sensor installed, power node updated, and initial changes made to home control software.
- October 11, 2004 - Graphing support added to water heater data.
- October 12, 2004 - Cost analysis of shower.
- January 15, 2005 - A 15 day absence provided information on
the
efficacy of the insulation of the water heater. During that
period, the water heater did not run a single time! Presuming
that it was about to cycle the burner upon our return, we can calculate
the upper bound of the heat wasted per day through the insulation of
the tank. Since the water heater runs for about 11 minutes at
a
minimum (due to its hysteresis), the maximum average run time (due to
energy lost) is 11/15 minute per day. Using the data in the
table
above, a calculation shows that it costs less than 0.5 cents per day to
maintain the water hot in the water heater. I found this very
low
amount very amazing.