| Home | Job | Pinball | Photo Album | Automotive | Press/Awards | Contact |

The main controller and GUI
Background
In 1991, I started my hobby of home automation, and began by using a PCjr as my controller. Using a third-party parallel port, I was able to attach a TW523 for X-10 I/O, a Infra Red Interface so that I could send and receive commands to the A/V system, and a telephone interface so that I could receive DTMF (touch tone) and hook status. The jr was ideally suited because it has a video output (which was then piped around the house on an unused channel), and a cordless IR keyboard. I built a niche into the wall of my house in a central location, and installed the jr into it for continuous duty.
The PCjr installed in a niche for dedicated use as controller.
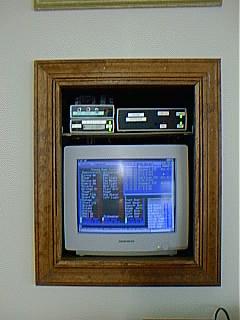
The second generation home controller using a Pentium.
The jr was reasonably smart. It could mute the TV or stereo when a call came in. I could control the house with any phone, and it turned on and off lights in somewhat intelligent fashion based on the darkness level outside and inside. It also was able to 'translate' and forward commands so I could trigger X-10 events based on received X-10 events. However, a few years ago, I outgrew this system, and started working on the system described next.
A GUI based home control system
The new system uses a Pentium, and runs a GUI environment based on Borland's TurboVision. This is a lean windowing enviroment that runs in DOS. Many OEMs used to build their products with this GUI class before Windows came along. Borland 3.1's IDE is written using TurboVision.
This is a screen shot of the controller's user interface.
There are four main windows (shown above). The left window is the home status and control window. The user is able to see the status of a unit (based on the most recent command sent to that unit) and is able to click on the unit to send it commands. This window scrolls and resizes to show other levels of the home. In addition, more control and status windows can be created to show a particular part of the home's status. For example, another control window can be created and resized to show just a few units, and then placed in an unused area of the desktop.
The second window in the top right is the Events window. This shows data such as:
- X-10 commands sent or received
- For incoming calls, the name and number of the caller
- For outgoing calls, the number of the caller
- Infra Red commands sent or received
- General event messages such as controller actions
The third window in the bottom right shows the current weather conditions. Weather data is archived every day, and can be plotted on a graphical page. In addition, the past 24 hour's weather data can be plotted so show trends.
The fourth window is the thermostat control panel. The HVAC setpoints can be controlled here. Also is displayed the temperature of the intake and output plenums to monitor the performance of the two HVAC units (main gas furnace or heat pump).
The weather reporting system
A screen shot of the graphical page showing
weather data for the past 24 hours
Ten environment parameters are plotted for comparison. Starting in the upper left and going down, the system plots the wind speed max (yellow) and wind speed average (white) on the same chart, below that is wind direction, then barometer, and rain total. On the upper right we have outside temp (white) and dew point (green) on the same chart, then below that is outside humidity, then inside temperature, and finally inside humidity. The wind direction is plotted as a number from 0 to 12, and corresponds to the wind direction as the face of a clock. The twelve and 0 o'clock positions correspond to North, and 6 o'clock correspond to south. This makes it easier for my wife to visualize quickly the direction of the wind. Instead of saying that the wind is from the South-south-west, I say that the wind is coming from the 7 o'clock position.
Each chart has a time line on the bottom. The right most edge is present time (or midnight if this is archived data). Then going left is the amount of hours in the past. The left most edge is 24 hours in the past. The accuracy of this data can be verified by comparing it with the data base from the local NBC affiliate. They offer 24 hour charts of any day, and I made a comparison.
Incoming storms can be interesting to track. The above set of charts document a storm system that moved thru my area on March 26, 1997. In chronological order, the barometer hits a low at about -20 hrs, then the humidity and dew point go up as moist air moves in. At the same time the wind changes direction as the low passes and the wind picks up. Shortly thereafter, the rain gauge registers rainfall. The front passes and a peak wind speed of 43 mph is registered at near -18 hrs. Then the air slowly dried out until at -15 hrs when the dew point and humidity drop from saturated. The winds slowly dies in magnitude as the storm leaves. I find it fascinating how all weather parameters correlate to each other when a storm passes.

Example of examining data on a chart
The exact value of a environment parameter can be examined by clicking the mouse pointer on a chart. The horizontal position specifies the time of the parameter, and its value and time stamp is shown in blue. For example, in the outside humidity chart above, the humidity was 37.09% at 19:45. By left-clicking to the left or right of the line, the user can move the line toward the pointer, and see successive values for that parameter. Right clicking removes the blue marker and text.
Central Controller Intelligence
The control program is based on events. These events can be the receipt of an X-10 or IR command, the arrival of a certain time, tripping of a sensor, and many more. These events can in turn trigger commands. It is this automatic tending of the home that epitomizes home automation. Some of the automatic actions implemented are:- Incoming calls mute the audio/video system
- the opening of doors or the tripping of motion detectors will trip the alarm system if appropriately armed, or turn on a light if needed, these lights are turned off after a timer expires
- X-10 commands are 'remapped' to others, allowing macros where one button push triggers other events such as IR commands, or spoken words. This allows the setting of 'scenes'.
- When the security system is armed in the 'away' mode, lights are turned on and off psuedorandomly to simulate occupancy.
- Sufficient rain fall suppresses the irrigation of the garden.
- Upon nightfall, selected lights are turned on
- Upon sun rise, an 'All Lights Off' is sent to all house codes
- Motion detected outside the home causes a light to turn on (if it is at night) and a chime to sound inside the house
- Commands to a certain house code are combined pair wise so that the entire house can be addressed. This allows controllers with a limited number of buttons (mini controllers, wrist watch, telephones) to control the whole house
- More
Home Control Network
The central controller is connected to the rest of the computer network via its serial port. This allows the code to run on any PC with at least DOS 5.0 and a serial port. This was important to me so that I could use an old computer or laptop if I wanted to. The serial port is connected to my Node 0 (as I call it), which then translates the data to EIA/RS485.Other communication features
The system also has other features such as the auto fax. All events are logged to a file. If the user desires it, the system is set up to be able to fax this text file to a designated phone number. This is useful when I am on travel, it allows me to get daily reports from my house, and I can know who called and when, if the irrigation commands were sent, and so forth. The text to fax package is from Turbopower Software.Another communication option is that the system can also send
a
message
to my numerical pager. This is useful when there are urgent events to
send
to me. Finally, a new addition is the ability to send email
reports.